Markov Chains and English Text Synthesis
Introduction
The main objective of this project is to understand the information content of the English Langauge. Claude Shannon also known as father of information theory in his paper has described a method of estimating the entropy and redundancy of a langauge is described. His method show cased the statistics possessed by people who speak english language by predicting the next letter when previous letter was known. In order to achieve this experimentally, Shannon used some human subjects. These subjects were shown some random excerpts of written english text. Shannon conducted his experiment by using English text from Jefferson the Virginian by Dumas Malone and subjects were provided with 100 previous characters and were asked to predict the next character. The character could be one of the 27 symbols: ‘A’, ‘B’, ‘C’, ‘D’, ‘E’, ‘F’, ‘G’, ‘H’, ‘I’, ‘J’, ‘K’, ‘L’, ‘M’, ‘N’, ‘O’, ‘P’, ‘Q’, ‘R’, ‘S’, ‘T’, ‘U’, ‘V’, ‘W’, ‘X’, ‘Y’, ‘Z’, ' ‘. The special symbols like punctuation were removed.
Here in our work we do perform similar experiment by reading texts written by author Jules Verne: (1) Journey to the Center of the Earth, (2) Five Weeks in a Baloon, (3) Robur the Conqueror, and (4) The master of the world. These data is read into digital format and is preprocessed to remove the special symbols and consist of only those 27 symbols/characters. All the alphabets are converted to upper case and converting line returns, tabs and multi-spaces to a single space. In order to process these characters we need to compute histograms.
Histograms are converted by assigning a number to the alphabets i.e., 1-26 to ‘A’-‘Z’ and 27 to ' ‘. Histogram for 1-gram messages is computed by counting the occurrences of each symbol in the dataset. To compute empirical probability p1(X) we take each value from histogram and divide it with total number of characters in the dataset. In the following tables we compute empirical probabilities and compare with Shannon’s results.
Empirical probabilities
| Symbol | Shannon’s Results | Sunny’s Results |
|---|---|---|
| ' ' | 18.2 | 18.2459 |
| ‘E’ | 10.7 | 10.6404 |
| ‘T’ | 8.6 | 7.8664 |
| ‘A’ | 6.7 | 6.4232 |
| ‘O’ | 6.5 | 6.2202 |
| ‘N’ | 5.8 | 5.5854 |
| ‘I’ | 5.6 | 5.4019 |
| ‘S’ | 5.2 | 5.1406 |
| ‘H’ | 5.0 | 5.0813 |
| ‘R’ | 4.3 | 4.8978 |
| ‘D’ | 3.1 | 3.4913 |
| ‘L’ | 2.8 | 3.2136 |
| ‘U’ | 2.4 | 2.4193 |
| ‘C’ | 2.3 | 2.2068 |
| ‘F’ | 2.1 | 1.9699 |
| ‘W’ | 2.0 | 1.9030 |
| ‘M’ | 1.6 | 1.8745 |
| ‘G’ | 1.6 | 1.5760 |
| ‘P’ | 1.6 | 1.4397 |
| ‘Y’ | 1.3 | 1.3544 |
| ‘B’ | 1.2 | 1.2335 |
| ‘V’ | 0.8 | 0.8100 |
| ‘K’ | 0.3 | 0.5794 |
| ‘X’ | 0.1 | 0.1642 |
| ‘J’ | 0.1 | 0.1184 |
| ‘Q’ | 0.1 | 0.0737 |
| ‘Z’ | 0.1 | 0.0692 |
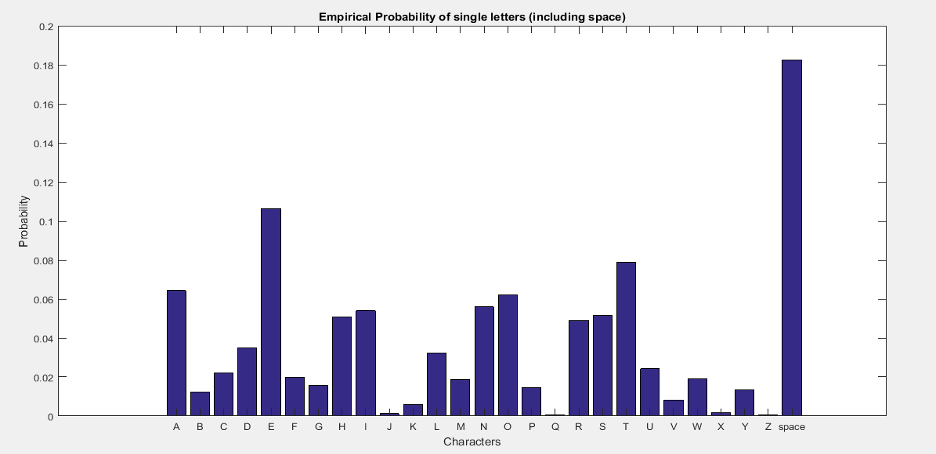
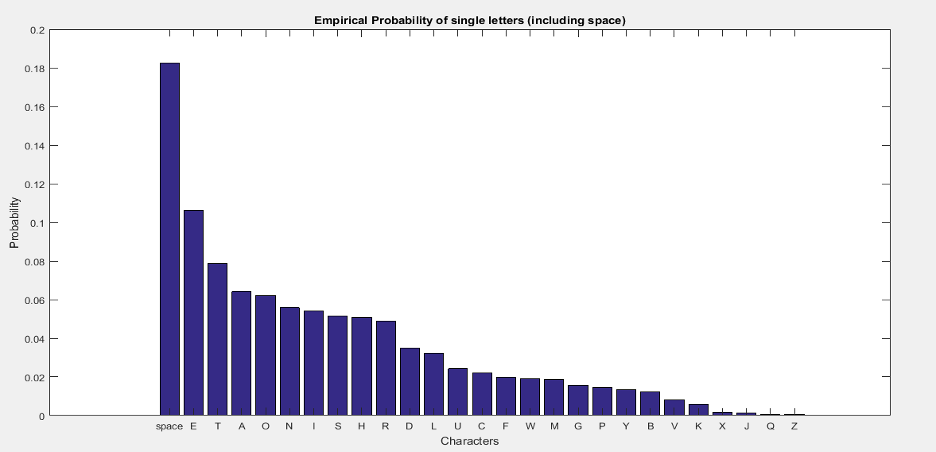
The table above shows the empirical probabilities for 1-gram messages. We see that we have achieved closer results as of Shannon. The graph of empirical probabilities of each alphabet is shown in figure below.
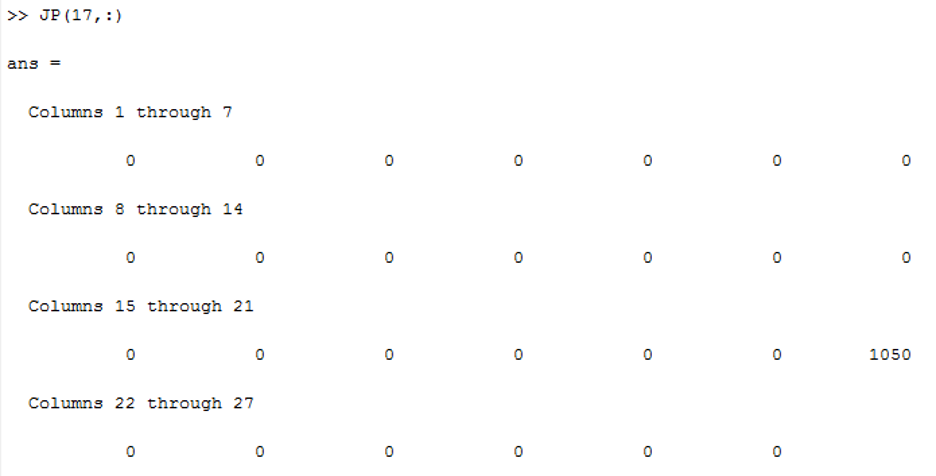
Similarly, we evaluate empirical probability of all consecutive letter pairs, p2(X). In order to verify that we check the probability of ‘U’ given ‘Q’ i.e, p2(X2=‘U’|X1=‘Q’) which should be approximately equal to one. From the following figure we see that among all alphabets only 1050 is present. Here 17 corresponds to character ‘Q’ and we see the distribution has only values of ‘U’. So its conditional distribution is equal to one.
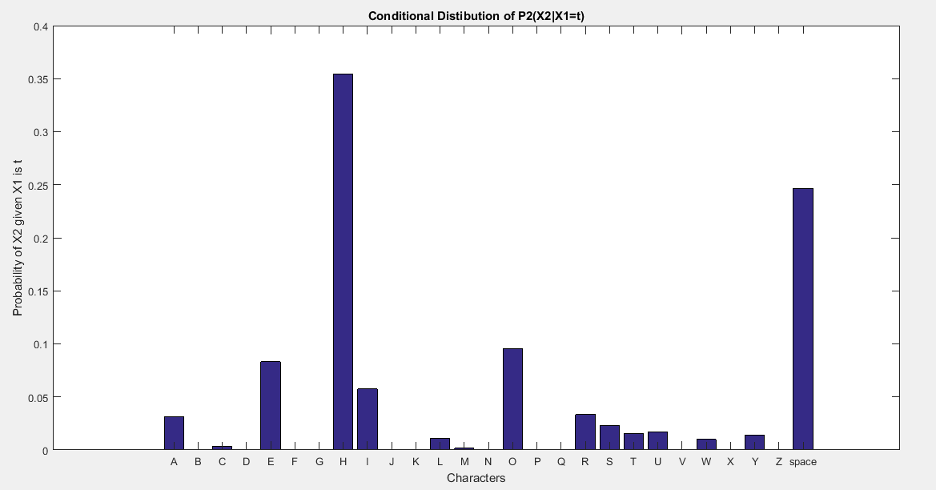
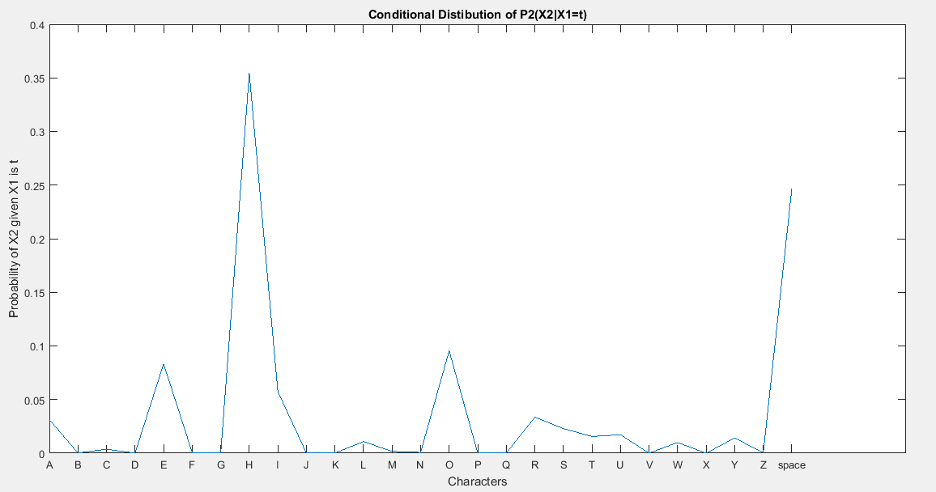
Similarly the conditional distribution on ‘T’ i.e., p2(X2|X1=‘T’) is shown in the figures below.
Entropy
Entropy is defined as the amount of “information” or “surprise” or uncertainty" any random variable inherent with variable possible outcomes. Given a discrete random variable X, with possible outcomes x1, x2, …, xn, which occur with probability of P(x1), P(x2), …, P(xn), the entropy of X is formally defined as:
$$\mathrm{H}(X)=-\sum_{i=1}^{n} \mathrm{P}\left(x_{i}\right) \log \mathrm{P}\left(x_{i}\right)$$ where $\sum$ denotes the sum over the variable possible values and $\log$ is the logarithm and changes based on applications. Base 2 gives the unit of bits or shannons while e gives natural units (wikipedia)[https://en.wikipedia.org/wiki/Entropy_(information_theory)].
We calculate entropies of p1(X) and p2(X1, X2) and compare our results with Shannon’s work as shown in table below:
| Shannon’s Results | Sunny’s Results | |
|---|---|---|
| Entropy of P1 | 4.03 | 4.088 |
| Entropy of P2 | 3.32 | (7.418073-4.088833) = 3.330073 |
Similarly, we also compare the entropies of p3(X1, X2, X3) and p4(X1, X2, X3, X4) with Shannon’s results in the table below:
| Shannon’s Results | Sunny’s Results | |
|---|---|---|
| Entropy of P3 | 3.1 | (10.131455-7.418073) = 2.713382 |
| Entropy of P4 | 2.14 | (12.262374-10.131455) = 2.130919 |
The entropies look similar with minute difference. We see that the entropies completely matches when we go the higher probabilities. The entropies keep on decreasing when we are going up the probability. This case seems same in my results and Shannon’s results as the dataset is different for Shannon’s and ours we get values close to Shannon’s showing the beauty of English language.
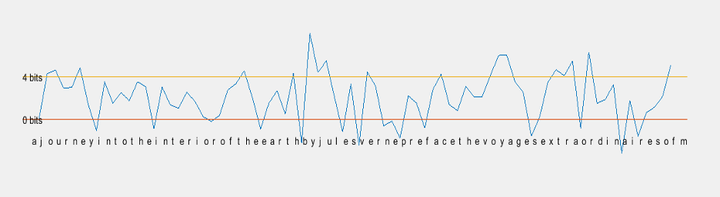
Prediction of English
We then perform character prediction by taking random samples of 4 symbols from text dataset and extend the series to 300 characters by sampling from the conditional distribution p4(X4|X1,X2,X3) ie., given previous three characters and predicting the next character. Our code was able to generate the following results:
C AND THIS ENOME TWO STOMS OF THEY AT WATERRATER YOUR PASS IN THAT ALWARDS OF A GLOBE UPON A PERATER SIDEAVE TREES WE APPILES AND HE RESIDENTS DUST OF WATCH RETURG THE ASKED A GIVENT OF THAT CAPRIA WOOD ONE TO AT DAY TO DES OF SHALL BEEN FAST THERLY TWO BEASY IN THE STUPIERS WHICH INVING AS HE DO IN TH
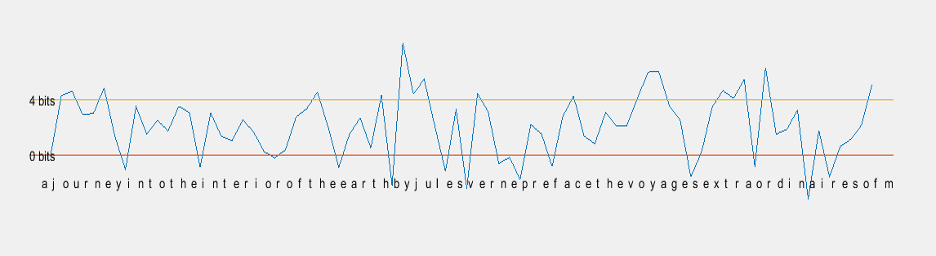
Later I obtained the Mutual Information as a predictor by removing the spaces using the formula $\log_2(p_4(X_1,X_2,X_3, X_4)/p_2(X_1,X_2)p_2(X_3,X_4))$ with upper and lower word boundaries.
Automate Shannon’s Game
100 strings were extracted from the text data where each string consists of 5 characters. p1(X1) is the first letter guess of each string. Then the sequence was required to guess in decreasing order of its probabilities. We performed this for p1(X), p2(X1, X2), p3(X1, X2, X3) and p4(X1, X2, X3, X4). In the following figure, the column corresponds to the number of preceding letters known to the subjects plus 1; the row is the number of guesses. The entry on column N at row S is the number of times the subject guessed the right letter at the Sth guess when (N-1) letters were shown. Foe example the entry 19 in column 3, row 2, (Sunny’s results) means that with two letters knows the correct letter was obtained on second guess nineteen times. The comparison table figure is shown below.
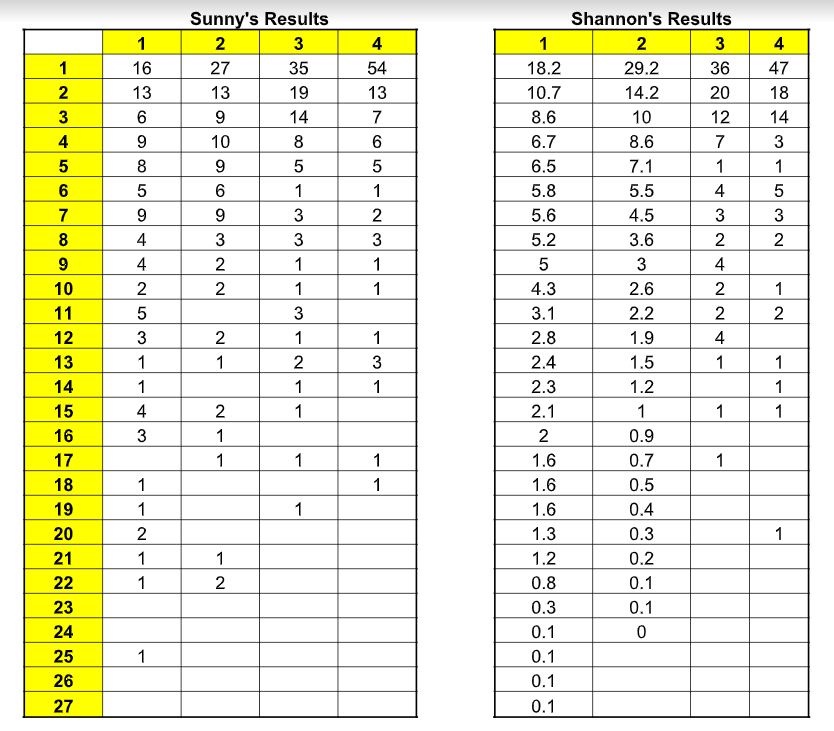
Here we conclude that sunny’s results look similar and close to that of Shannon’s results. In both the tables we see that the probability increases as the surprise decreases, means the probability of guessing right increases. This concludes that as we go higher the probability we will be able to guess the right character with lesser chances.
Sunny Arokia Swamy Bellary
Research Engineer - Robotics
EPRI Engineer | AI Enthusiast | Computer Vision Researcher | Robotics Tech Savvy | Food Lover | Wanderlust | Team Leader @Belaku | Musician |