Blood Donation Prediction
Introduction
“Blood is the most precious gift that anyone can give to another person — the gift of life.” ~ World Health Organization
Forecasting blood supply is a serious and recurrent problem for blood collection managers: in January 2019, “Nationwide, the Red Cross saw 27,000 fewer blood donations over the holidays than they see at other times of the year.” Machine learning can be used to learn the patterns in the data to help to predict future blood donations and therefore save more lives.
In this Project, you will work with data collected from the donor database of Blood Transfusion Service Center in Hsin-Chu City in Taiwan. The center passes its blood transfusion service bus to one university in Hsin-Chu City to gather blood donated about every three months. The dataset, obtained from the UCI Machine Learning Repository, consists of a random sample of 748 donors. Your task will be to predict if a blood donor will donate within a given time window. You will look at the full model-building process: from inspecting the dataset to using the tpot library to automate your Machine Learning pipeline.
1. Inspecting transfusion.data file

Blood transfusion saves lives - from replacing lost blood during major surgery or a serious injury to treating various illnesses and blood disorders. Ensuring that there's enough blood in supply whenever needed is a serious challenge for the health professionals. According to WebMD, "about 5 million Americans need a blood transfusion every year".
Our dataset is from a mobile blood donation vehicle in Taiwan. The Blood Transfusion Service Center drives to different universities and collects blood as part of a blood drive. We want to predict whether or not a donor will give blood the next time the vehicle comes to campus.
The data is stored in datasets/transfusion.data and it is structured according to RFMTC marketing model (a variation of RFM). We'll explore what that means later in this notebook. First, let's inspect the data.
# Print out the first 5 lines from the transfusion.data file
# Print out the first 5 lines from the transfusion.data file
!head -n5 datasets/transfusion.data
2. Loading the blood donations data
We now know that we are working with a typical CSV file (i.e., the delimiter is ,, etc.). We proceed to loading the data into memory.
# Import pandas
import pandas as pd

# Read in dataset
transfusion = pd.read_csv("datasets/transfusion.data")

# Print out the first rows of our dataset
# ... YOUR CODE FOR TASK 2 ...
transfusion.head()
| Recency (months) | Frequency (times) | Monetary (c.c. blood) | Time (months) | whether he/she donated blood in March 2007 | |
|---|---|---|---|---|---|
| 0 | 2 | 50 | 12500 | 98 | 1 |
| 1 | 0 | 13 | 3250 | 28 | 1 |
| 2 | 1 | 16 | 4000 | 35 | 1 |
| 3 | 2 | 20 | 5000 | 45 | 1 |
| 4 | 1 | 24 | 6000 | 77 | 0 |
3. Inspecting transfusion DataFrame
Let's briefly return to our discussion of RFM model. RFM stands for Recency, Frequency and Monetary Value and it is commonly used in marketing for identifying your best customers. In our case, our customers are blood donors.
RFMTC is a variation of the RFM model. Below is a description of what each column means in our dataset:
- R (Recency - months since the last donation)
- F (Frequency - total number of donation)
- M (Monetary - total blood donated in c.c.)
- T (Time - months since the first donation)
- a binary variable representing whether he/she donated blood in March 2007 (1 stands for donating blood; 0 stands for not donating blood)
It looks like every column in our DataFrame has the numeric type, which is exactly what we want when building a machine learning model. Let's verify our hypothesis.
# Print a concise summary of transfusion DataFrame
# ... YOUR CODE FOR TASK 3 ...
transfusion.info()
<class 'pandas.core.frame.DataFrame'>
RangeIndex: 748 entries, 0 to 747
Data columns (total 5 columns):
Recency (months)                              748 non-null int64
Frequency (times)                             748 non-null int64
Monetary (c.c. blood)                         748 non-null int64
Time (months)                                 748 non-null int64
whether he/she donated blood in March 2007    748 non-null int64
dtypes: int64(5)
memory usage: 29.3 KB
4. Creating target column
We are aiming to predict the value in whether he/she donated blood in March 2007 column. Let's rename this it to target so that it's more convenient to work with.
# Rename target column as 'target' for brevity
transfusion.rename(
    columns={'whether he/she donated blood in March 2007': 'target'},
    inplace=True
)

# Print out the first 2 rows
# ... YOUR CODE FOR TASK 4 ...
transfusion.head(2)
| Recency (months) | Frequency (times) | Monetary (c.c. blood) | Time (months) | target | |
|---|---|---|---|---|---|
| 0 | 2 | 50 | 12500 | 98 | 1 |
| 1 | 0 | 13 | 3250 | 28 | 1 |
5. Checking target incidence
We want to predict whether or not the same donor will give blood the next time the vehicle comes to campus. The model for this is a binary classifier, meaning that there are only 2 possible outcomes:
0- the donor will not give blood1- the donor will give blood
Target incidence is defined as the number of cases of each individual target value in a dataset. That is, how many 0s in the target column compared to how many 1s? Target incidence gives us an idea of how balanced (or imbalanced) is our dataset.
# Print target incidence proportions, rounding output to 3 decimal places
# ... YOUR CODE FOR TASK 5 ...
transfusion.target.value_counts(normalize=True).round(3)
0    0.762
1    0.238
Name: target, dtype: float64
6. Splitting transfusion into train and test datasets
We'll now use train_test_split() method to split transfusion DataFrame.
Target incidence informed us that in our dataset 0s appear 76% of the time. We want to keep the same structure in train and test datasets, i.e., both datasets must have 0 target incidence of 76%. This is very easy to do using the train_test_split() method from the scikit learn library - all we need to do is specify the stratify parameter. In our case, we'll stratify on the target column.
# Import train_test_split method
from sklearn.model_selection import train_test_split

# Split transfusion DataFrame into
# X_train, X_test, y_train and y_test datasets,
# stratifying on the `target` column
X_train, X_test, y_train, y_test = train_test_split(
    transfusion.drop(columns='target'),
    transfusion.target,
    test_size=0.25,
    random_state=42,
    stratify=transfusion.target
)

# Print out the first 2 rows of X_train
# ... YOUR CODE FOR TASK 6 ...
X_train.head(2)
| Recency (months) | Frequency (times) | Monetary (c.c. blood) | Time (months) | |
|---|---|---|---|---|
| 334 | 16 | 2 | 500 | 16 |
| 99 | 5 | 7 | 1750 | 26 |
7. Selecting model using TPOT
TPOT is a Python Automated Machine Learning tool that optimizes machine learning pipelines using genetic programming.
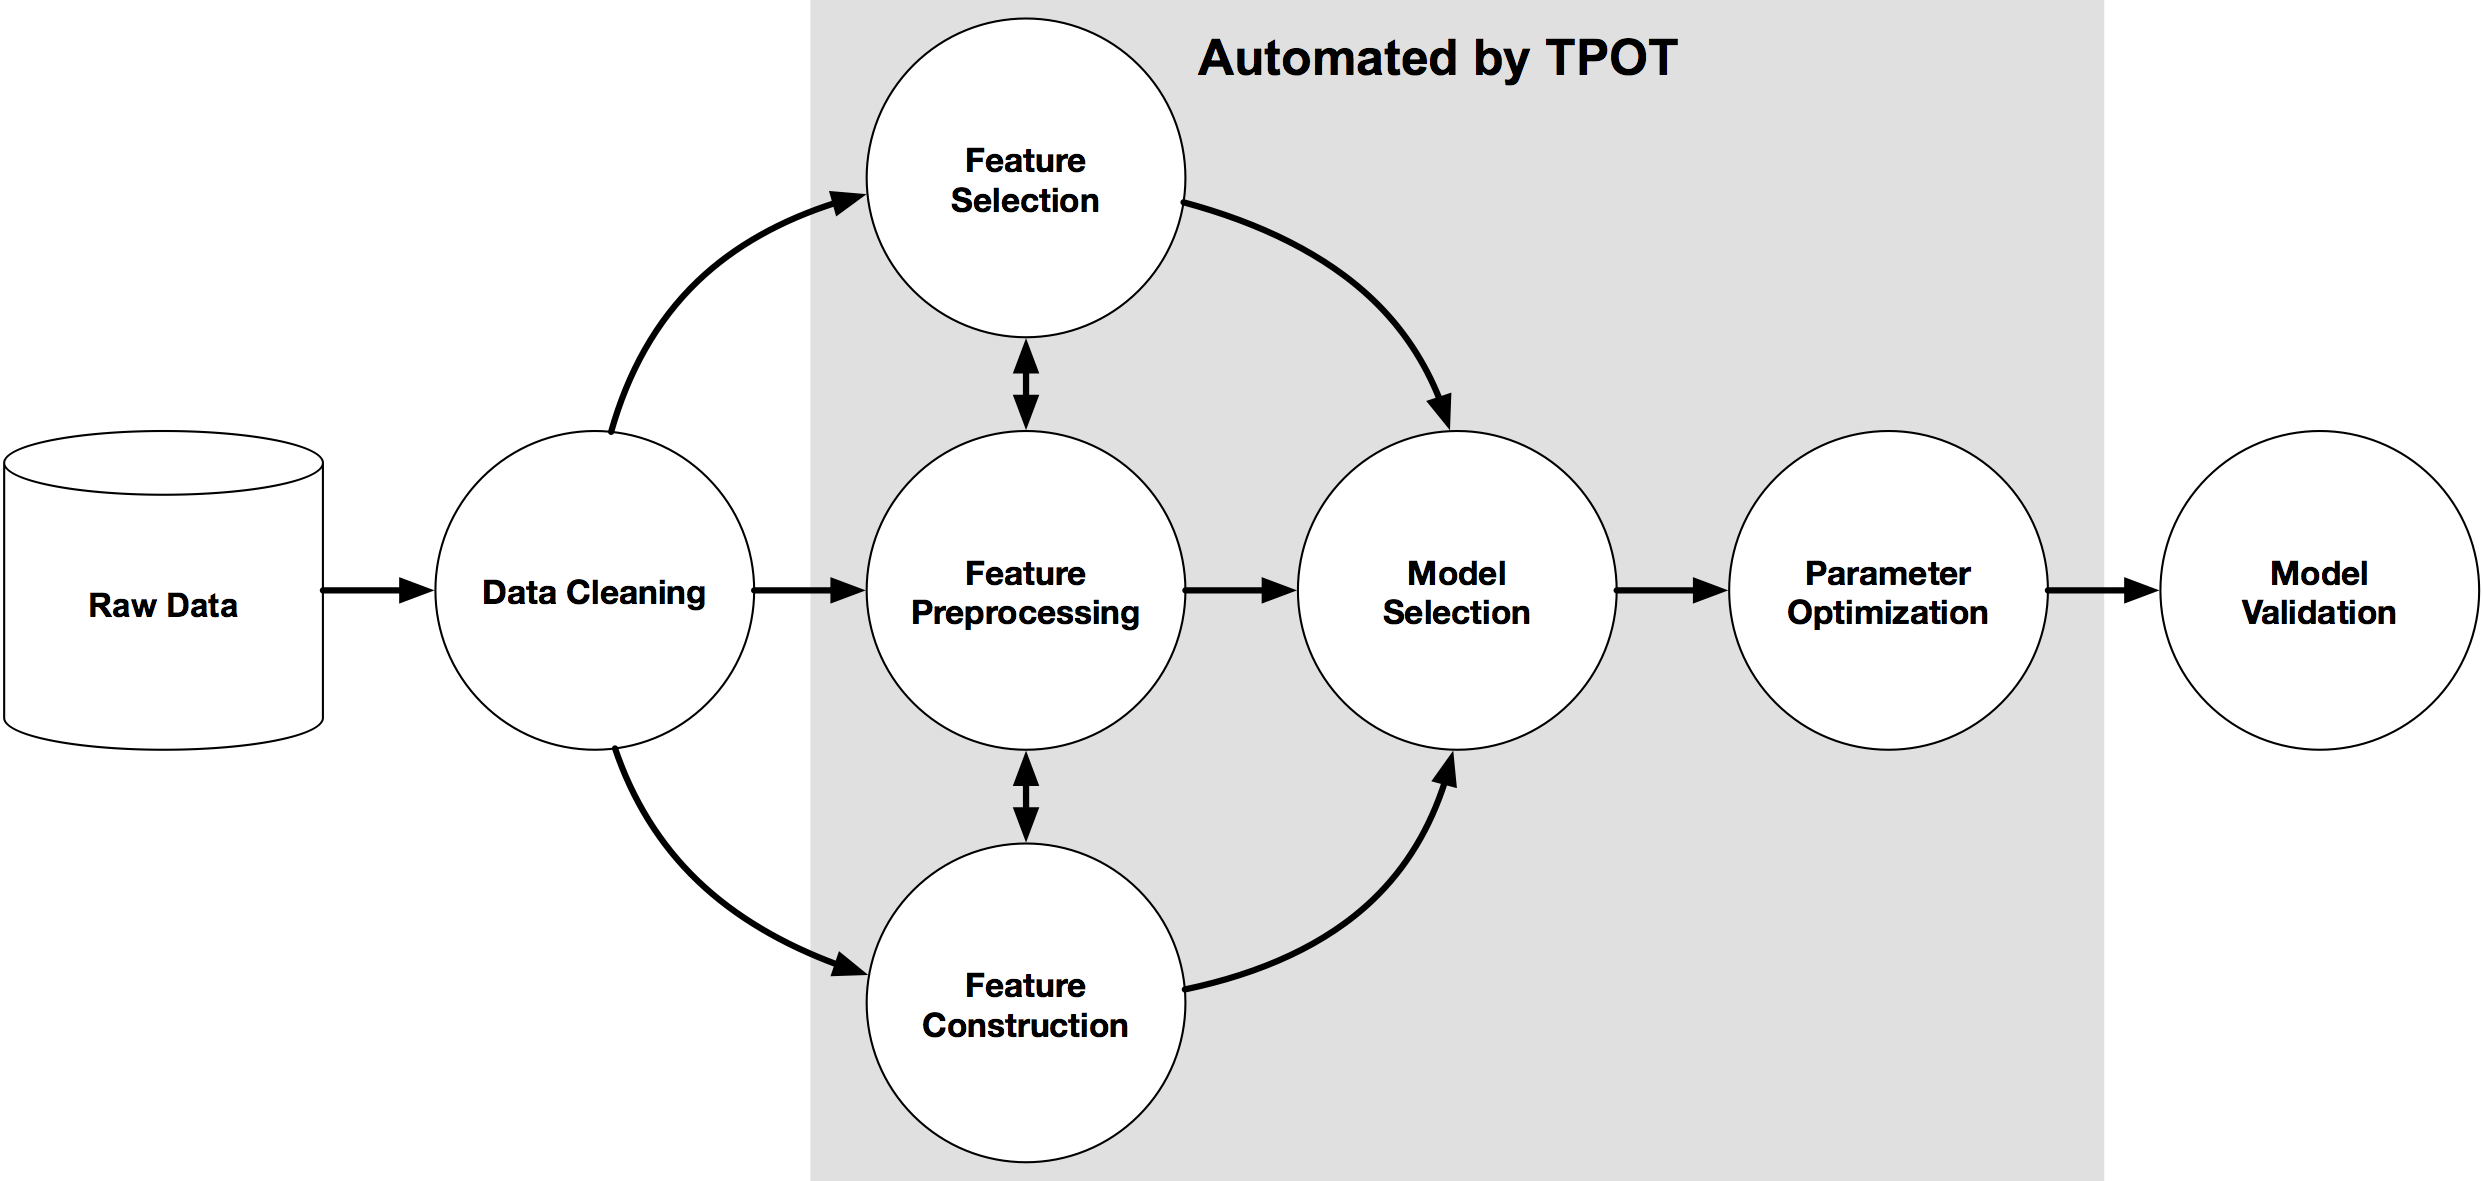
TPOT will automatically explore hundreds of possible pipelines to find the best one for our dataset. Note, the outcome of this search will be a scikit-learn pipeline, meaning it will include any pre-processing steps as well as the model.
We are using TPOT to help us zero in on one model that we can then explore and optimize further.
# Import TPOTClassifier and roc_auc_score
from tpot import TPOTClassifier
from sklearn.metrics import roc_auc_score

# Instantiate TPOTClassifier
tpot = TPOTClassifier(
    generations=5,
    population_size=20,
    verbosity=2,
    scoring='roc_auc',
    random_state=42,
    disable_update_check=True,
    config_dict='TPOT light'
)
tpot.fit(X_train, y_train)

# AUC score for tpot model
tpot_auc_score = roc_auc_score(y_test, tpot.predict_proba(X_test)[:, 1])
print(f'\nAUC score: {tpot_auc_score:.4f}')

# Print best pipeline steps
print('\nBest pipeline steps:', end='\n')
for idx, (name, transform) in enumerate(tpot.fitted_pipeline_.steps, start=1):
    # Print idx and transform
    print(f'{idx}. {transform}')
HBox(children=(HTML(value='Optimization Progress'), FloatProgress(value=0.0, max=120.0), HTML(value='')))


Generation 1 - Current best internal CV score: 0.7433977184592779
Generation 2 - Current best internal CV score: 0.7433977184592779
Generation 3 - Current best internal CV score: 0.7433977184592779
Generation 4 - Current best internal CV score: 0.7433977184592779
Generation 5 - Current best internal CV score: 0.7433977184592779

Best pipeline: LogisticRegression(input_matrix, C=0.5, dual=False, penalty=l2)

AUC score: 0.7850

Best pipeline steps:
1. LogisticRegression(C=0.5, class_weight=None, dual=False, fit_intercept=True,
          intercept_scaling=1, max_iter=100, multi_class='warn',
          n_jobs=None, penalty='l2', random_state=None, solver='warn',
          tol=0.0001, verbose=0, warm_start=False)
8. Checking the variance
TPOT picked LogisticRegression as the best model for our dataset with no pre-processing steps, giving us the AUC score of 0.7850. This is a great starting point. Let's see if we can make it better.
One of the assumptions for linear regression models is that the data and the features we are giving it are related in a linear fashion, or can be measured with a linear distance metric. If a feature in our dataset has a high variance that's an order of magnitude or more greater than the other features, this could impact the model's ability to learn from other features in the dataset.
Correcting for high variance is called normalization. It is one of the possible transformations you do before training a model. Let's check the variance to see if such transformation is needed.
# X_train's variance, rounding the output to 3 decimal places
# ... YOUR CODE FOR TASK 8 ...
X_train.var().round(3)
Recency (months)              66.929
Frequency (times)             33.830
Monetary (c.c. blood)    2114363.700
Time (months)                611.147
dtype: float64
9. Log normalization
Monetary (c.c. blood)'s variance is very high in comparison to any other column in the dataset. This means that, unless accounted for, this feature may get more weight by the model (i.e., be seen as more important) than any other feature.
One way to correct for high variance is to use log normalization.
# Import numpy
import numpy as np

# Copy X_train and X_test into X_train_normed and X_test_normed
X_train_normed, X_test_normed = X_train.copy(), X_test.copy()

# Specify which column to normalize
col_to_normalize = 'Monetary (c.c. blood)'

# Log normalization
for df_ in [X_train_normed, X_test_normed]:
    # Add log normalized column
    df_['monetary_log'] = np.log(df_[col_to_normalize])
    # Drop the original column
    df_.drop(columns=col_to_normalize, inplace=True)

# Check the variance for X_train_normed
# ... YOUR CODE FOR TASK 9 ...
X_train_normed.var().round(3)
Recency (months)      66.929
Frequency (times)     33.830
Time (months)        611.147
monetary_log           0.837
dtype: float64
10. Training the linear regression model
The variance looks much better now. Notice that now Time (months) has the largest variance, but it's not the orders of magnitude higher than the rest of the variables, so we'll leave it as is.
We are now ready to train the linear regression model.
# Importing modules
from sklearn import linear_model

# Instantiate LogisticRegression
logreg = linear_model.LogisticRegression(
    solver='liblinear',
    random_state=42
)

# Train the model
logreg.fit(X_train_normed, y_train)

# AUC score for tpot model
logreg_auc_score = roc_auc_score(y_test, logreg.predict_proba(X_test_normed)[:, 1])
print(f'\nAUC score: {logreg_auc_score:.4f}')
AUC score: 0.7891
11. Conclusion
The demand for blood fluctuates throughout the year. As one prominent example, blood donations slow down during busy holiday seasons. An accurate forecast for the future supply of blood allows for an appropriate action to be taken ahead of time and therefore saving more lives.
In this notebook, we explored automatic model selection using TPOT and AUC score we got was 0.7850. This is better than simply choosing 0 all the time (the target incidence suggests that such a model would have 76% success rate). We then log normalized our training data and improved the AUC score by 0.5%. In the field of machine learning, even small improvements in accuracy can be important, depending on the purpose.
Another benefit of using logistic regression model is that it is interpretable. We can analyze how much of the variance in the response variable (target) can be explained by other variables in our dataset.
# Importing itemgetter
from operator import itemgetter

# Sort models based on their AUC score from highest to lowest
sorted(
    [('tpot', tpot_auc_score), ('logreg', logreg_auc_score)],
    key=itemgetter(1),
    reverse=True
)
[('logreg', 0.7890972663699937), ('tpot', 0.7849650349650349)]
Credits
This is a Datacamp project and I Thank Dimitri Denisjonok a Python Backend Developer at Futrll for designing this project for datacamp.
Sunny Arokia Swamy Bellary
Research Engineer - Robotics
EPRI Engineer | AI Enthusiast | Computer Vision Researcher | Robotics Tech Savvy | Food Lover | Wanderlust | Team Leader @Belaku | Musician |